Association of hyperuricemia with angiographic severity of coronary artery disease in chronic stable angina patients
Published in Journal of Cardiovascular Diseases
Arnab Kumar Chowdhury
Arnab Kumar Chowdhury More articles by this author →Md. Wadud Chowdhury1
Md. Wadud Chowdhury- 1 Prof. Dr, Md. Wadud Chowdhury, MBBS, MD, Professor &Head of Cardiology, Dhaka, Medical College, Dhaka,Bangladesh.
Suman Kumar Saha
Suman Kumar Saha More articles by this author →Md. Akteruzzaman2
Md. Akteruzzaman- 2 Dr.Md. Akteruzzaman, MBBS, MD, Junior Consultant Cardiology, Sathkira Medical College Hospital, Sathkira, Bangladesh
Anjuman Ara Begum
Anjuman Ara Begum More articles by this author →Sushanta Barua
Sushanta Barua More articles by this author →
Show affiliations (2)
- 1Prof. Dr, Md. Wadud Chowdhury, MBBS, MD, Professor &Head of Cardiology, Dhaka, Medical College, Dhaka,Bangladesh.
- 2Dr.Md. Akteruzzaman, MBBS, MD, Junior Consultant Cardiology, Sathkira Medical College Hospital, Sathkira, Bangladesh
Published
Abstract
BackgroundThe relationship between serum uric acid and chronic stable angina remains contentious. While its association with cardiovascular risk is debated, this study aimed to investigate the correlation between serum uric acid levels and the angiographic severity of coronary artery disease in patients with chronic stable angina.
MethodsA cross-sectional analytical study was conducted on 158 patients presenting with chronic stable angina at Dhaka Medical College Hospital from January to December 2022. Hyperuricemia was defined as serum uric acid levels ≥ 6.5 mg/ dl. The severity of coronary artery disease was assessed using the Gensini score and the vessel score on coronary angiogram.
ResultsHyperuricemic patients (n=72) had significantly higher conventional risk factors (hypertension, diabetes, dyslipidemia) and lipid profile abnormalities compared to the normouricemic group (n=86). Notably, hyperuricemic patients were more likely to have a vessel score of 3 (severe coronary artery disease) and had significantly higher Gensini scores, indicating greater disease severity. A strong positive correlation was observed between serum uric acid levels and both Gensini score and vessel score.
ConclusionsThis study demonstrates a significant positive association between serum uric acid levels and the severity of coronary artery disease in patients with chronic stable angina. Early diagnosis and management of hyperuricemia may be crucial in reducing adverse clinical outcomes and improving the quality of life for these patients.
1 Introduction#
Chronic stable angina, a common manifestation of coronary artery disease (CAD), remains a significant global health concern. CAD is the leading cause of death worldwide, with an estimated 17.9 million deaths in 2019.South Asian populations, including those from Bangladesh, are disproportionately affected, exhibiting a 3-5 fold increased risk of myocardial infarction compared to other ethnicities.[1,2]The dynamic nature of CAD results in various clinical presentations, including chronic coronary syndromes (CCS). Patients with suspected or established CCS often experience stable angina symptoms, dyspnea, or have a history of heart failure. Accurate risk stratification is crucial for guiding appropriate management strategies, including pharmacological and interventional interventions.[3]
Serum uric acid (UA) has emerged as a potential biomarker for cardiovascular disease (CVD) risk.[4] Numerous studies have demonstrated a strong association between elevated UA levels and the severity of CAD.[5, 6] However, the relationship between UA and the angiographic severity of coronary artery disease in chronic stable angina patients in Bangladesh remains understudied.
This study aims to investigate the association between hyperuricemia and the angiographic severity of coronary artery disease in patients with chronic stable angina in Bangladesh. By exploring the relationship between UA levels and CAD severity, this research could contribute to improved risk stratification and tailored treatment approaches for patients in this high-risk population.
2 Methodology#
2.1 Study Design#
Cross-sectional analytical study
2.2 Place of Study#
Department of Cardiology, Dhaka Medical College Hospital, Dhaka, Bangladesh
Study period: January 2022 - December 2022
2.3 Study Population#
Patients with chronic stable angina admitted to the cardiology department during the study period.
2.4 Sample#
- Sample size: 158
- Sampling method: Purposive sampling
- Inclusion criteria:
º Chronic stable angina patients undergoing elective coronary angiography
- Exclusion criteria:
º Gout, malignancy
º Previous revascularization (PCI, CABG)
º First 4 weeks of acute coronary syndrome
º Heart failure (NYHA class III-IV)
º Medications affecting uric acid levels (diuretics, allopurinol, febuxostat)
º Renal impairment (creatinine ≥ 2.0 mg/dl)
º Acute infection, chronic alcoholism
º Pregnancy
º Unwilling to give consent
2.5 Study Variables#
2.6 Independent Variables#
Demographic variables: Age, sex Risk factor variables: Family history of CAD, diabetes mellitus, hypertension, smoking, dyslipidemia Laboratory parameters: Serum uric acid, fasting lipid profile, RBS, FBS, serum creatinine
Dependent Variable: Angiographic severity of coronary disease: Vessel score, Gensini score
2.7 Data Collection#
A pre-formed semi-structured questionnaire collected demographic, clinical, and angiographic information. Blood samples were drawn for analysis of serum uric acid and other biochemical parameters. Coronary angiograms were performed to assess coronary artery disease severity.
2.8 Data Analysis#
Data was analyzed using SPSS software (version 25).Descriptive statistics were used to summarize data (mean, standard deviation, median, range, percentages).Statistical tests were used to compare groups (t-test, Chi-square test, Fisher’s exact test).Correlation analysis was used to assess the relationship between serum uric acid and Gensini score. Regression analysis was used to identify independent predictors of severe CAD.
2.9 Ethical Considerations#
Ethical approval was obtained from the Dhaka Medical College ethical review committee. Informed written consent was obtained from all participants in Bangla or the local language. Participant confidentiality was maintained.
3 Results#
This cross-sectional analytical study was conducted in the department of Cardiology, DMCH, from January 2022 to December 2022. The main objective of this study was to find out the association between hyperuricemia with angiographic severity of coronary artery disease in chronic stable angina patients. Serum uric acid of 158 patients with chronic stable angina was recorded in the data collection sheet. The study participants were divided into two groups according to the value of serum uric acid (mg/dl). Hyperuricemia is usually defined as serum uric acid concentration >7.0 mg/dl or > 420 µmol/L in men and > 6.0 mg/dl or > 360 µmol/L in women (Goodarzynejad et al. 2010). However, in our study, for the purpose of the analysis and calculation, we used the normal reference range of 3.5-6.5 mg/dl, which was used in two previous studies (Pramanik et al., 2015 and Qureshi, Hameed and Noeman, 2013). Hence, in our study, hyperuricemia was defined as serum uric acid concentration ≥ 6.5 mg/dl. The study participants were divided in two groups.
GROUP-A: Serum Uric Acid ≥ 6.50 mg/dl (Hyperuricemia) GROUP-B: Serum Uric Acid < 6.50 mg/dl (Normouricemia). Table-1 shows comparison of age distribution among sample population. The mean age of the participants of group A was 52.60 ± 9.66 years and group B was 52.26 ± 9.90 years, which was not statistically significant (p > 0.05). Participants who were aged between 46-55 years old had highest serum uric acid level 5.81 mg/dl with a SD of 1.59.
Table-I: Sample Characteristics (n=158)
Table II Serum uric acid level across different age groups (n=158).
| Age (years) | GROUP-A Hyperuricemia (n=72) Frequency (%) | GROUP-B Normouricemia (n=86) Frequency (%) | p-value |
|---|---|---|---|
| ≤ 45 years | 15 (20.8) | 26 (30.2) | |
| 46-55 years | 32 (44.4) | 32 (37.2) | |
| >55 years | 25 (34.7) | 28 (32.6) | 0.388ns |
| Mean ± SD (in years) | 52.60 ± 9.66 | 52.26 ± 9.90 | 0.828ns |
| Age category | Serum Uric Acid (mg/dl) Mean ± SD |
|---|---|
| ≤ 45 years | 5.53 ± 1.56 |
| 46-55 years | 5.81 ± 1.59 |
| >55 years | 5.75 ± 1.43 |
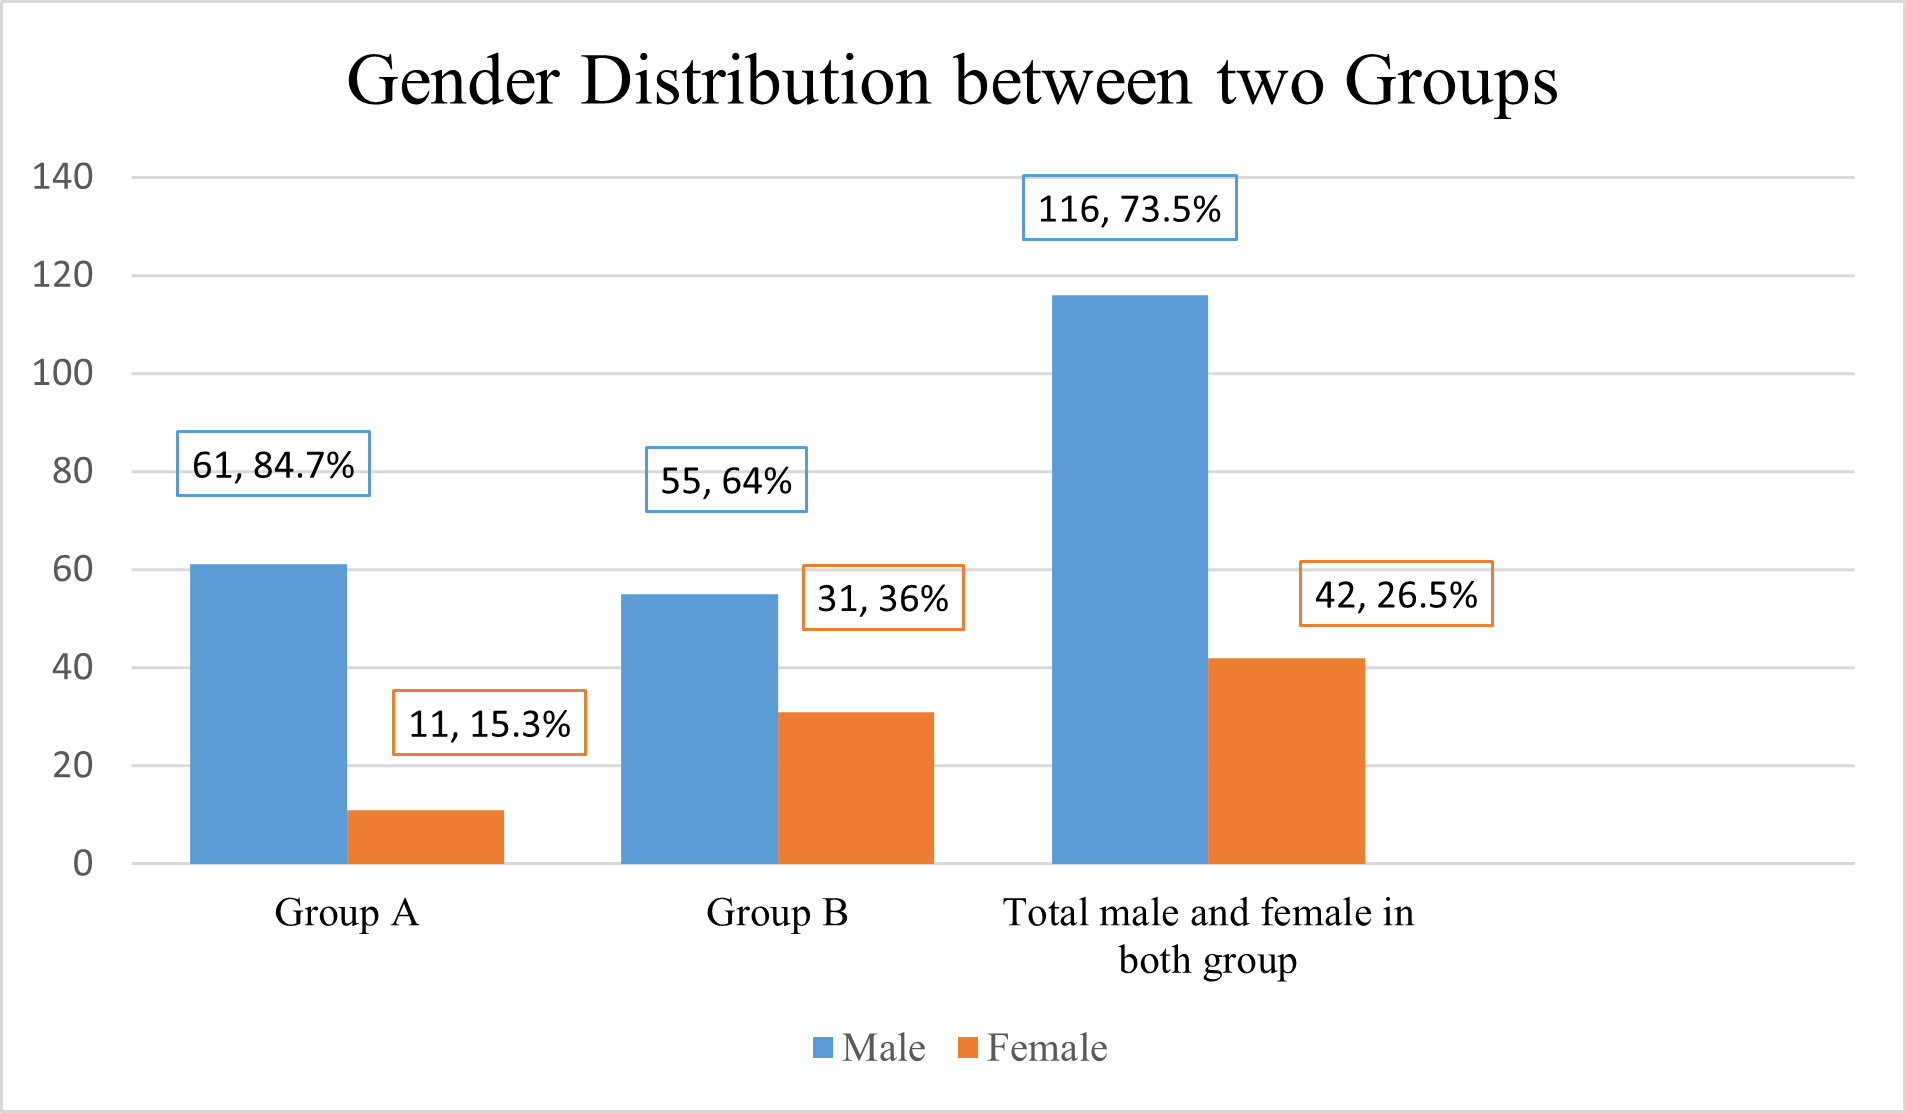
Among sample population total 116 (73.5%) patients were male, 42 (26.5%) patients were female. In group A 84.7% (61) were male and 15.3% (11) were female. In group B 64% (53) were male and 36% (31) were female. This distribution was statistically significant (p value = 0.003). Male female ratio was 3:1.
Table III Comparison of conventional risk factors of CAD between two groups (n=158).
| Variables | GROUP-A Hyperuricemia (n=72) Frequency (%) | GROUP-B Normouricemia (n=86) Frequency (%) | p-value |
|---|---|---|---|
| Family history of premature CAD | 32 (44.4) | 33 (38.4) | 0.440ns |
| Smoker | 45 (62.2) | 44 (51.2) | 0.152ns |
| Hypertension | 63 (87.5) | 44 (51.2) | <0.001s |
| Diabetes Mellitus | 55 (76.4) | 49 (57) | 0.010s |
| Dyslipidemia | 60 (83.3) | 47 (54.7) | <0.001s |
Data presented as frequency and percentages over columns GROUP-A: Serum Uric Acid ≥ 6.50 mg/dl, GROUP-B: Serum Uric Acid < 6.50 mg/dl
The above table shows that among the conventional CVD risk factors hypertension, diabetes mellitus, dyslipidemia was higher in group A, which was statistically significant (p<0.05). No significant difference between the groups was found in case of smoking and family history of premature CAD.
Table IV Comparison of biochemical parameters between groups (n =158)
| Variables | GROUP-A Hyperuricemia (n=72) | GROUP-B Normouricemia (n=86) | p-value |
|---|---|---|---|
| Mean ± SD | Mean ± SD | ||
| Serum Uric Acid (mg/dl) | 7.13 ± 0.40 | 4.53 ± 1.03 | <0.001s |
| TC (mg/dl) | 187.86±36.56 | 153.97±31.59 | <0.001s |
| LDL (mg/dl) | 106.65±21.25 | 86.27±25.35 | <0.001s |
| HDL (mg/dl) | 36.87 ± 5.59 | 37.76 ± 5.79 | 0.314ns |
| TG (mg/dl) | 212.54 ± 91.02 | 143.65 ± 57.00 | <0.001s |
| FBS (mmol/L) | 8.04 ± 1.83 | 8.12 ± 2.34 | 0.360ns |
| RBS (mmol/L) | 11.16 ± 2.88 | 9.99 ± 3.23 | 0.017s |
| Serum Creatinine (mg/dl) | 1.03 ± 0.28 | 1.03 ± 0.30 | 0.740ns |
Data presented as mean ± SD over columns, GROUP-A: Serum Uric Acid ≥ 6.50 mg/dl GROUP-B: Serum Uric Acid < 6.50 mg/dl, s =significant, ns = not significant p value reached from unpaired t-test and Mann Whitney U-test
Above table shows differences in mean FBS, HDL and serum creatinine between two groups were not statistically significant (p>0.05). In lipid profile study, HDL was found lower in group A compared with group B. TC, LDL, TG, SUA and RBS were found significantly different between groups (p<0.05).
Table V Comparison of angiographic parameters and severity of CAD between two groups according to vessel score (n=158).
| Variables | GROUP-A Hyperuricemia (n=72) | GROUP-B Normouricemia (n=86) | p-value |
|---|---|---|---|
| Severity of CAD (Vessel Score) | Frequency (%) | Frequency (%) | <0.001s |
| Score 0 | 7 (9.7) | 39 (45.3) | |
| Score 1 | 11 (15.3) | 22 (25.6) | |
| Score 2 | 18 (25) | 12 (14) | |
| Score 3 | 36 (50) | 13 (15.1) |
Data presented as frequency and percentages over columns. GROUP-A: Serum Uric Acid ≥ 6.50 mg/dl ; GROUP-B: Serum Uric Acid < 6.50 mg/dl s =significant p value reached from Mann Whitney U-test and chi square test.
Above table shows that most of the study participants of (36, 50%) group A and (13, 15.1%) participants of group B had “score 3”. The difference was statistically significant (p<0.001).
Table VI Comparison of severity of CAD between two groups according to Gensini score (n=158)
| Variables | GROUP-A Hyperuricemia (n=72) | GROUP-B Normouricemia (n=86) | p-value |
|---|---|---|---|
| Mean ± SD | Mean ± SD | ||
| Gensini Score | 57.76 ± 31.23 | 20.43 ± 26.11 | <0.001s |
Data presented as Mean ± SD over columnsGROUP-A: Serum Uric Acid ≥ 6.50 mg/dL GROUP-B: Serum Uric Acid < 6.50 mg/dL s =significant p value reached from Mann Whitney U-test and chi square test
Above table shows that Group A patients had significantly higher mean Gensini score than Group B patients which was 57.76 ± 31.23 and 20.43 ± 26.11 respectively. This difference was statistically significant (p<0.001).
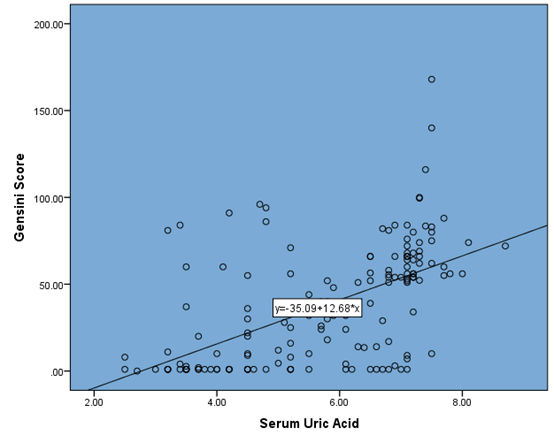
Correlation co-efficient, rs =0.700 (p value < 0.001)
This figure shows that there was a significant positive correlation between serum uric acid and CAD severity in terms of vessel score. Correlation co-efficient, r = 0.850 and it was statistically significant (p value < 0.001) by Spearman’s rank order correlation test.
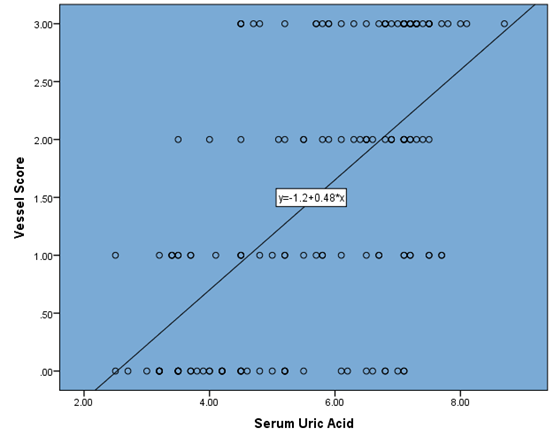
Scatter diagram showing correlation between Serum uric Acid and vessel score by Spearman’s rank order correlation test.Correlation coefficient, rs = 0.850 (p value < 0.001).
This figure shows that there was a significant positive correlation between serum uric acid and CAD severity in terms of vessel score. Correlation co-efficient, r = 0.850 and it was statistically significant (p value < 0.001) by Spearman’s rank order correlation test.
Table VII Linear regression analysis of biochemical parameters with severity of CAD according to Gensini Score
| Variables | Gensini Score | ||
|---|---|---|---|
| Beta co-efficient | R2 | p-value | |
| Serum uric Acid | 0.571 | 0.326 | <0.001s |
| FBS | 0.010 | 0.000 | 0.901ns |
| RBS | 0.172 | 0.030 | 0.031s |
| Serum creatinine | 0.200 | 0.017 | 0.012s |
| TC | 0.286 | 0.082 | <0.001s |
| HDL | 0.228 | 0.052 | 0.004s |
| LDL | 0.307 | 0.094 | <0.001s |
| TG | 0.298 | 0.089 | <0.001s |
Dependent variable: Gensini Score Independent Variable (s): Serum Uric Acid, FBS, RBS, Serum creatinine, TC, HDL, LDL, TG s =significant ; ns = not significant
Above table is showing significant linear relation of Serum Uric Acid, RBS, Serum creatinine, TC, HDL, LDL and TG with Gensini score. By reading the beta coefficient, we learn that with 1 unit increase of SUA, RBS, Serum creatinine, TC, HDL, LDL and TG, Gensini Score will increased by 0.571, 0.172, 0.20, 0.286, 0.228, 0.307, 0.298 respectively.
Table VIII Multivariate Linear Regression analysis for several risk factors effects on severity of CAD assessed by Gensini score
| Variable | B | SE | β | 95% CI | p-value | |
|---|---|---|---|---|---|---|
| Gender | -5.140 | 4.784 | -0.072 | -14.591 | 4.311 | 0.284ns |
| Hypertension | -1.209 | 4.743 | -0.018 | -10.579 | 8.161 | 0.799ns |
| Diabetes Mellitus | 9.267 | 4.506 | 0.147 | 0.365 | 18.170 | 0.041s |
| Dyslipidemia | -7.236 | 4.857 | -0.111 | -16.833 | 2.361 | 0.138ns |
| Serum Uric Acid | 12.406 | 1.368 | 0.601 | 9.702 | 15.109 | <0.001s |
Dependent variable: Gensini Score
Independent variables: Gender, Hypertension, Diabetes Mellitus, Dyslipidemia, Serum Uric Acid s=significant ns = non significant
Table shows that the unstandardized regression coefficients (B) of several risk factors of CAD. Among these DM (9.267; p=0.041) and serum uric acid (12.406; p<0.001) significantly influencing the gensini score, since p-value is <0.05. The other variables in the study (Gender, Hypertension, Dyslipidemia) do not have any significant influence in explaining the Gensini score. The unstandardized coefficient (B), also called multiple regression coefficient, for serum uric acid is 12.406 (95% CI: 9.702 to 15.109). This means that the average increase or decrease in Gensini score is 12.406, if serum uric acid increase or decrease by 1 mg/dl, after adjusting for all other variables (Gender, HTN, DM, Dyslipidemia) in this study.
4 Discussion#
This cross-sectional study aimed to investigate the relationship between serum uric acid levels and the severity of coronary artery disease (CAD) in patients with chronic stable angina. A total of 158 patients underwent coronary angiography and were categorized into two groups based on their serum uric acid levels: Group A (hyperuricemia, ≥6.50 mg/dL) and Group B (normouricemia12, <6.50 mg/dL). The study found a significant positive association between SUA levels and the severity of CAD. Patients with hyperuricemia had higher SUA levels, more severe CAD as measured by the Gensini score, and were more likely to have multiple vessel involvement. Multivariate analysis revealed SUA as an independent predictor of CAD severity, even after adjusting for traditional risk factors.
4.1 Demographics and Risk Factors#
The majority of participants in both groups were between 46 and 55 years old, with a mean age of 52.41 years. There was no significant difference in age between the two groups. Males were more prevalent in both groups, with a statistically significant difference (p=0.003). Hypertension, diabetes mellitus, and dyslipidemia were more prevalent in the hyperuricemic group compared to the normouricemic group. However, there were no significant differences in smoking or family history of premature CAD between the groups. In several previous studies had found same similarity.[8, 9, 10]
Laboratory Findings: In addition to higher SUA levels, patients in the hyperuricemic group had higher levels of total cholesterol (TC), low-density lipoprotein (LDL), triglycerides (TG), and fasting blood sugar (FBS). These findings suggest a cluster of metabolic abnormalities associated with hyperuricemia and increased CAD risk. ). Our finding was consistent with previous studies conducted by Duran et al. (2012), Madbouly et al. (2022), Qureshi, Hameed and Noeman (2013).[11, 12,13]
4.2 Coronary Artery Disease Severity#
Gensini scores, a measure of CAD severity, were significantly higher in Group A (57.76 ± 31.23) compared to Group B (20.43 ± 26.11).A positive correlation was found between serum uric acid levels and both Gensini scores and vessel scores, indicating a stronger association with more severe CAD. Our finding was similar to previous studies conducted by Pramanik et al. (2015), Madbouly et al. (2022), Qureshi, Hameed and Noeman (2013), and Deveci et al. (2010).[8,12,13,14]
4.3 Correlation Analysis#
The study demonstrated a strong positive correlation between SUA levels and both the Gensini score and vessel score, indicating a direct relationship between SUA and the severity of CAD. These positive correlations were in agreement with other similar studies done by Madbouly et al. (2022), Qureshi, Hameed and Noeman (2013), Deveci et al. (2010) and Akanda et al. (2012).[12,13,14,15]
4.4 Regression Analysis#
Multivariate linear regression analysis revealed serum uric acid as an independent predictor of CAD severity, even after adjusting for confounding factors. Other independent predictors included TC, LDL, TG, random blood sugar (RBS), and serum creatinine. By performing a multi-variate linear regression analysis model Lv et al. (2019) showed that a non-traditional CAD risk factor (HUA [OR 8.28; 95% CI 1.96–14.59; p = 0.01]) were significant risk factors for the severity of CAD after adjusting for confounding factors.[10]
4.5 Clinical Implications#
Elevated serum uric acid levels may be a useful marker for predicting severe CAD in patients with chronic stable angina. Patients with both conventional cardiovascular risk factors and hyperuricemia may be at a higher risk of severe CAD. Early identification of high-risk patients through uric acid assessment can lead to more intensive treatment and improved outcomes.
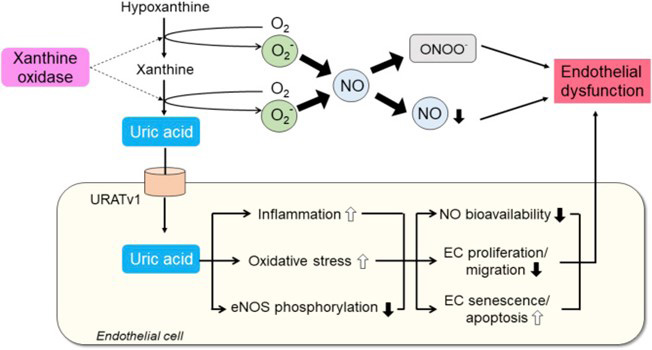
Consider adding a discussion of the potential mechanisms linking serum uric acid to CAD, such as oxidative stress, inflammation, and endothelial dysfunction. Also, discuss the limitations of the study, such as its cross-sectional design, and the need for further research to establish causality.
5 Conclusion#
This study provides evidence that elevated SUA levels are associated with increased severity of CAD in patients with chronic stable angina. These findings underscore the importance of considering SUA as a risk factor for CAD and highlight the potential benefits of targeting SUA in clinical management.
Article information
- Published
This article is published open access under the CC BY 4.0 licence. CC BY 4.0 · Corrections policy
References 15#
- 1
Ohman, E.M. (2016) ‘Chronic Stable Angina’, New England Journal of Medicine. Edited by C.G. Solomon, 374(12), pp. 1167–1176.
- 2
Khanam, F., Hossain, M.B., Mistry, S.K., Afsana, K. and Rahman, M., 2019. Prevalence and risk factors of cardiovascular diseases among Bangladeshi adults: findings from a cross-sectional study. Journal of epidemiology and global health, 9(3), pp.176-184.
- 3
Knuuti, J. (2020) ‘2019 ESC Guidelines for the diagnosis and management of chronic coronary syndromes The Task Force for the diagnosis and management of chronic coronary syndromes of the European Society of Cardiology (ESC)’, Russian Journal of Cardiology, 25(2), pp. 119–180.
- 4
Rathmann, W., Funkhouser, E., Dyer, A.R. and Roseman, J.M. (1998) ‘Relations of Hyperuricemia with the Various Components of the Insulin Resistance Syndrome in Young Black and White Adults: The CARDIA Study’, Annals of Epidemiology, 8(4), pp. 250–261.
- 5
Cannon, P.J., Stason, W.B., Demartini, F.E., Sommers, S.C. and Laragh, J.H. (1966) ‘Hyperuricemia in Primary and Renal Hypertension’, New England Journal of Medicine, 275(9), pp. 457–464.
- 6
Ford, E.S., Li, C., Cook, S. and Choi, H.K. (2007) ‘Serum Concentrations of Uric Acid and the Metabolic Syndrome among US Children and Adolescents’, Circulation, 115(19), pp. 2526–2532.
- 7
Maruhashi, T., Hisatome, I., Kihara, Y. and Higashi, Y. (2018) ‘Hyperuricemia and endothelial function: From molecular background to clinical perspectives’, Atherosclerosis, 278, pp. 226–231.
- 8
Pramanik, S., Mondal, K., Dey, A.K., Mandal, P.K., Das, S.K., Momin, T.W., Mitra, M., Mondal, M. and Dutta, S.N. (2015) ‘A study of angiographic severity in patients with coronary artery disease and hyperuricemia’, Asian Journal of Medical Sciences, 7(2), pp. 1–4.
- 9
Raza, S.A., Anjum, N., Ayaz, S.B., Khalid, K., Saleem, M. and Yousaf, M.J. (2021) ‘FREQUENCY OF HYPERURICEMIA IN PATIENTS WITH CORONARY ARTERY DISEASE AND ITS ASSOCIATION WITH DISEASE SEVERITY, AGE, GENDER, DIABETES MELLITUS, AND HYPERTENSION’, Pak Armed Forces Med J, 71(2), pp. 651–54.
- 10
Lv, S., Liu, W., Zhou, Y., Liu, Y., Shi, D., Zhao, Y., Liu, X., Alhelal, J.W. and Ravuru, K.S.S. (2019) ‘Hyperuricemia and severity of coronary artery disease: An observational study in adults 35 years of age and younger with acute coronary syndrome’, Cardiology Journal, 26(3), pp. 275–282.
- 11
Duran, M., Kalay, N., Akpek, M., Orscelik, O., Elcik, D., Ocak, A., Inanc, M.T., Kasapkara, H.A., Oguzhan, A., Eryol, N.K., Ergin, A. and Kaya, M.G. (2012) ‘High Levels of Serum Uric Acid Predict Severity of Coronary Artery Disease in Patients with Acute Coronary Syndrome’, Angiology, 63(6), pp. 448–452.
- 12
Madbouly, M., Boghdady, A., Abd El Hady, Y. and Abd El Meguid, K. (2022) ‘Correlation between Hyperuricemia and Severity of Coronary Artery Disease Detected by Coronary Angiography in Men and Women’, Egyptian Journal of Medical Research, 3(4), pp. 7–19.
- 13
Qureshi, A.E., Hameed, S. and Noeman, A. (2013) ‘Relationship of serum uric acid level and angiographic severity of coronary artery disease in male patients with acute coronary syndrome’, Pakistan Journal of Medical Sciences, 29(5).
- 14
Deveci, O.S., Kabakci, G., Tulumen, E., Okutucu, S., Aksoy, H., Kaya, E.B., Canpolat, U., Aytemir, K., Tokgozoglu, L. and Oto, A. (2010) ‘The Relationship Between Micro albuminuria and the Presence and Extent of Coronary Atherosclerosis’, Angiology, 61(2), pp. 184–191.
- 15
Akanda, M., Choudhury, K., Ali, Mz, Naher, S., Islam, A. and Ali, Mi (2012) ‘Serum Uric Acid and Its Association with Coronary Artery Disease’, Cardiovascular Journal, 5(1), pp. 12–1.