Full Text Hide / show
Introduction
Diabetes mellitus (DM) is a complex metabolic disorder that has become a global epidemic, posing a significant threat to public health [1]. The increasing incidence of cardiovascular disease (CVD) and chronic kidney disease (CKD) in individuals with diabetes has become a major concern, as these comorbidities elevate the risk of adverse cardiovascular events and renal complications [2-6]. The interconnectedness of diabetes, CVD, and CKD highlights the need for therapeutic strategies that extend beyond glycemic control [3-7]. SGLT2 inhibitors, emerging as a promising class of medications, have shown the potential to address both hyperglycemia and associated cardiovascular and renal complications [8]. These medications, by inhibiting the reabsorption of glucose in the kidneys, lower blood sugar levels and exert protective effects on the heart and kidneys [9].
This research aims to improve patient outcomes by establishing locally relevant data on the safety and efficacy of SGLT2 inhibitors. The study also extends to evaluating a broader range of metabolic parameters, including weight, BMI, glycemic indices, and lipid profiles. The complex and interconnected nature of T2DM as a systemic metabolic disorder justifies a comprehensive approach to understanding the therapeutic profile and protective effects of these medications. However, the precise mechanisms of these protective mechanisms are still under investigation. The study aims to evaluate the safety and effectiveness of SGLT2 inhibitors (dapagliflozin and empagliflozin) in type 2 diabetes patients, considering factors like demographics, medication use, potential synergistic effects, prescribing practices, side effects, and cardiorenal and metabolic changes over three months, considering factors like overweight, poor glycemic control, and renal protection.
Methods
Study Design The study used a mixed-methods design to assess changes in patient characteristics and baseline parameters after SGLT2 inhibitors were initiated. It included 600 patients with T2DM, aged 30 to 98, with 269 males and 331 females. Of these, 279 received dapagliflozin, and 321 received empagliflozin. The study assessed changes in patient characteristics and baseline parameters over three months. Inclusion and Exclusion Criteria The study objects to determine the eligibility criteria for T2DM treatment, including diagnosis, initiation of treatment, and meaningful data at the three-month follow-up visit. Exclusion criteria include T1DM, pregnancy, incomplete data, followup duration less than three months, and discontinuation of SGLT2 inhibitor within three months.
Data Collection
Thestudycollecteddatathroughpatientinterviews,structured questionnaires, and electronic medical records. It included demographics, medical and surgical history, SGLT2 inhibitor treatment history, medication use, and clinical parameters. At baseline and three months, data was collected on weight, height, BMI, BP, EF, FPG, PPG, HbA1c, lipid profile, albuminuria, plasma urea, plasma Cr, and eGFR. BMI was calculated as weight. The non-HDL-C, and eGFR was estimated using the Chronic Kidney Disease Epidemiology Collaboration. Data Handling and Sample Size The study focused on family history and EF analyses, with only 228 participants having complete family history data and 150 participants having complete EF data. Statistical Analysis The study used IBM SPSS Statistics version 23 to analyze data, calculating descriptive statistics like means, ranges, standard deviations, frequencies, and percentages for relevant variables.
Change from baseline was calculated as the difference after treatment minus before treatment, with p<0.001 being highly significant. Pearson’s correlation coefficients were used to evaluate linear relationships between variables. Ethical Considerations The study protocol received ethical approval from the research ethics committees of the University of Tripoli and the BDC. Verbal informed consent was obtained from all participants. Data were anonymized to maintain patient confidentiality following the Declaration of Helsinki.
Results
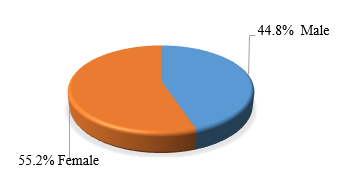
Patient Demographics, Baseline Clinical Characteristics, and SGLT2 Inhibitor Treatment. This study enrolled Libyan female patients (55.2%) compared to males (44.8%) in Fig 1. at the BDC between May 2022 and June 2023, with a majority falling within the 51-60 years age group (33.2%) and the 61-70 age group (31.8%, Table 1.). Only 6.2% had diabetes for more than 30 years with 43.3% having diabetes for 10-19 years (Table 1). Only 11.8% were smokers and 35.3% had a family history of T2DM (Table 1). The most commonly prescribed dosages were empagliflozin (10 mg) and dapagliflozin (5 mg, Table 1). The highest utilization was observed for dapagliflozin (36%). Figure 1. Gender Distribution of Participants.
As initially outlined in Figure 1, the study cohort consisted of 600 participants, with a slightly higher prevalence of females (55.2%) compared to males (44.8%). Further analysis was conducted to delineate the specific effects of dapagliflozin and empagliflozin across different demographics and clinical categories. Table 1. Characteristics of SGLT2 inhibitor use in patients with T2DM by gender (N=600). Characteristic Male Female Total Gender 269 (44.8%) 331 (55.2%) 600 (100%) Age ≤ 40 years 10 (3.7%) 3 (0.9%) 13 (2.2%) 41 – 50 years 43 (16.0%) 26 (7.9%) 69 (11.5%) 51 – 60 years 84 (31.2%) 115 (34.7%) 199 (33.2%) 61 – 70 years 69 (25.7%) 122 (36.8%) 191 (31.8%) 71 – 80 years 51 (19.0%) 59 (17.8%) 110 (18.3%) > 80 years 12 (4.5%) 6 (1.8%) 18 (3%) Duration of T2DM < 10 years 69 (25.7%) 75 (22.7%) 144 (24%) 10-19 years 103 (38.2%) 157 (47.4%) 260 (43.3%) 20-29 years 77 (28.6%) 82 (24.8%) 159 (26.5%) ≥ 30 years 20 (7.4%) 17 (5.1%) 37 (6.2%) Smoking Smoking 71 (26.4%) 0 (0%) 71 (11.8%) Non-smoking 198 (73.6%) 331 (100%) 529 (88.2%) Family history of T2DM Yes 97 (36.1%) 115 (34.7%) 212 (35.3%) No 6 (2.2%) 10 (3.0%) 16 (2.7%) Unavailable 166 (61.7%) 206 (62.1%) 372 (62%) SGLT2 inhibitors members and their doses Empagliflozin (all doses) (47.2%) (58.6%) (53.5%) Empagliflozin 25 mg 42 (15.6%) 53 (16.0%) 95 (15.8%) Empagliflozin 12.5 mg 20 (7.4%) 45 (13.6%) 65 (10.8%) Empagliflozin 10 mg 65 (24.2%) 96 (29.0%) 161 (26.8%) Dapagliflozin (all doses) (52.7%) (41.4%) (46.5%) Dapagliflozin 10 mg 98 (36.4%) 118 (35.7%) 216 (36%) Dapagliflozin 5 mg 44 (16.4%) 19 (5.7%) 63 (10.5%) The impact of SGLT2 inhibitor on the classification of essential cardiovascular and metabolic parameters The study examined the effects of SGLT2 inhibitors on clinical and biochemical parameters in 600 patients, with a subset of 155 patients examining EF (Table 2).
The administration of SGLT2 inhibitors led to significant improvements in various parameters, including weight, BMI, systolic and diastolic blood pressure, FPG, PPG, and HbA1c (P<0.001, Table 2,). Lipid profiles also improved, with significant reductions in TG, TC, LDL-C (P<0.001, Table 2) and non-HDL-C (P=0.004, Table 2). Renal parameters showed reduced plasma urea and Cr, an increase in eGFR, and a significant decrease in albuminuria (Table 2). The mean EF showed a notable increase, with a 47.06% decrease in albuminuria and a mean increase of 16.85% (P<0.001, Table 2). The study also found strong positive correlations between pre- and post-treatment values for most parameters, with the highest correlations for weight and BMI.
Moderate, significant associations were found for systolic and diastolic BP, and all other correlations were also significant and moderately positive. The study found a small standard error of the mean for each parameter at baseline and postintervention, with a mean height of 163.48 cm. Correlation analysis showed the highest correlation for pre-post changes in weight, BMI, and EF, with diastolic BP showing the lowest correlation. A paired t-test revealed a significant difference in all measured parameters due to SGLT2 administration, with several parameters showing highly significant changes with p < 0.001, and a significant change was noted in HDL-C. SGLT2 inhibitor administration resulted in significant improvements across several parameters, including weight, BMI, systolic BP, and diastolic BP.
Renal parameters were positively affected, with reduced plasma urea and plasma Cr, an increase in eGFR, a marked reduction in albuminuria, and a notable increase in the mean EF.Paired samples correlations indicated strong, significant (p < 0.001) positive correlations between pre- and post-treatment values for most parameters, with the highest correlations for weight and BMI (r = 0.99) for both. Moderate, significant associations were found for systolic (r = 0.68) and diastolic BP (r = 0.46), and all other correlations were also significant and moderately positive. Table 2. Effects of SGLT2 inhibitors on patient’s biological parameters (N = 600). Parameter Time point Mean SD SEM Change % Change P-value r Weight (Kg) Before 93.61 18.17 0.74 -3.77 -4.03 < 0.001 0.99 After 89.84 16.96 0.69 BMI (Kg/m2) Before 35.23 7.16 0.29 -1.43 -4.06 < 0.001 0.99 After 33.80 6.73 0.27 Systolic BP (mmHg) Before 131.78 16.26 0.66 -7.06 -5.36 < 0.001 0.68 After 124.72 13.86 0.57 Diastolic BP (mmHg) Before 82.09 9.38 0.38 -3.61 -4.39 < 0.001 0.46 After 78.48 6.87 0.28 FPG (mg/dL) Before 186.36 64.89 2.65 -37.63 -20.20 < 0.001 0.58 After 148.73 51.01 2.08 PPG (mg/dL) Before 217.59 74.43 3.04 -41.80 -19.21 < 0.001 0.65 After 175.79 62.90 2.57 HbA1c (%) Before 9.47 1.79 0.07 -1.25 -13.20 < 0.001 0.70 After 8.22 1.42 0.06 TG (mg/dL) Before 175.78 95.65 3.90 -39.91 -22.70 < 0.001 0.76 After 135.87 60.07 2.45 HDL-C (mg/dL) Before 43.97 14.59 0.60 1.18 2.68 0.004 0.75 After 45.15 13.56 0.55 TC (mg/dL) Before 171.45 46.08 1.88 -23.20 -13.53 < 0.001 0.64 After 148.25 39.40 1.61 Non-HDL-C (mg/dL) Before 125.67 47.03 1.92 -23.80 -18.94 < 0.001 0.62 After 101.87 39.08 1.60 LDL-C (mg/dL) Before 100.50 37.71 1.54 -15.10 -15.02 < 0.001 0.67 After 85.40 31.61 1.29 Plasma Urea (mg/dL) Before 33.46 14.38 0.59 -3.85 -11.51 < 0.001 0.66 After 29.61 10.91 0.45 Plasma Cr (mg/dL) Before 0.86 0.31 0.01 -0.13 -15.12 < 0.001 0.81 After 0.73 0.24 0.01 eGFR (mL/min/1.73m²) Before 84.74 21.86 0.89 9.12 10.76 < 0.001 0.83 After 93.86 19.56 0.80 Albuminuria (mg/g Cr) Before 120.44 287.84 11.75 -56.68 -47.06 < 0.001 0.86 After 63.76 177.85 7.26 EF (%) Before 45.87 12.65 1.02 7.73 16.85 < 0.001 0.89 After 53.60 11.27 0.91 Abbreviations: BMI: Body Mass Index; BP: Blood Pressure; Cr: Creatinine; EF: Ejection Fraction; eGFR: Estimated Glomerular Filtration Rate; FPG: Fasting Plasma Glucose; HbA1c: Glycated hemoglobin; HDL-C: High-Density Lipoprotein Cholesterol; LDL-C: Low-Density Lipoprotein Cholesterol; Non-HDL-C: Non-High-Density Lipoprotein Cholesterol; PPG: Postprandial Plasma Glucose; r: Correlation Coefficient; SD: Standard Deviation; SEM: Standard Error of the Mean; SGLT2: Sodium-glucose co-transporter 2; TC: Total Cholesterol; TG: Triglycerides.
Note: Paired t-tests were used to compare continuous variables from baseline to 3 months post-treatment. P < 0.05 was considered statistically significant, p < 0.01 highly significant, and p < 0.001 very highly significant. Table 3. Effects of SGLT2 inhibitors on male patient’s biological parameters (n = 269, EF n = 79). Parameter Time point Mean SD SEM Change % Change P-value r Weight (Kg) Before 95.41 17.60 1.07 -3.53 -3.70 < 0.001 0.99 After 91.88 16.53 1.01 BMI (Kg/m2) Before 32.42 6.02 0.37 -1.19 - 3.67 < 0.001 0.99 After 31.23 5.77 0.35 Systolic BP (mmHg) Before 132.20 17.80 1.09 -6.93 - 5.24 < 0.001 0.64 After 125.28 14.31 0.87 Diastolic BP (mmHg) Before 81.80 8.08 0.49 -3.40 - 4.15 < 0.001 0.36 After 78.40 6.37 0.39 FPG (mg/dL) Before 185.55 67.76 4.13 -38.55 -20.78 < 0.001 0.55 After 147.00 51.07 3.11 PPG (mg/dL) Before 213.77 70.45 4.30 -39.29 -18.38 < 0.001 0.62 After 174.48 64.08 3.91 HbA1c (%) Before 9.37 1.81 0.11 -1.26 - 13.44 < 0.001 0.67 After 8.11 1.43 0.09 TG (mg/dL) Before 178.74 107.75 6.57 -42.54 -23.80 < 0.001 0.78 After 136.20 65.92 4.02 HDL-C (mg/dL) Before 40.37 10.57 0.64 0.81 2.01 0.150 0.60 After 41.18 10.13 0.62 TC (mg/dL) Before 163.74 47.82 2.92 -23.42 -14.30 < 0.001 0.63 After 140.32 37.40 2.28 Non-HDL-C (mg/dL) Before 121.42 48.79 2.98 -23.72 -19.54 < 0.001 0.62 After 97.70 38.03 2.32 LDL-C (mg/dL) Before 96.56 38.46 2.35 -15.30 -15.84 < 0.001 0.64 After 81.27 31.96 1.95 Plasma urea (mg/dL) Before 34.78 15.13 0.92 -3.60 -10.38 < 0.001 0.63 After 31.18 11.32 0.69 Plasma Cr (mg/dL) Before 0.95 0.31 0.02 -0.13 -13.80 < 0.001 0.79 After 0.82 0.25 0.02 eGFR (mL/min/1.73m²) Before 86.82 22.62 1.38 8.78 10.11 < 0.001 0.83 After 95.60 20.82 1.27 Albuminuri (mg/g Cr) Before 144.53 318.03 19.39 -67.61 -46.78 < 0.001 0.85 After 76.92 210.29 12.82 EF (%) Before 41.15 11.18 1.26 9.10 22.11 < 0.001 0.85 After 50.25 10.45 1.18 Abbreviations: BMI: Body Mass Index; BP: Blood Pressure; Cr: Creatinine; EF: Ejection Fraction; eGFR: Estimated Glomerular Filtration Rate; FPG: Fasting Plasma Glucose; HbA1c: Glycated hemoglobin; HDL-C: High-Density Lipoprotein Cholesterol; LDL-C: Low-Density Lipoprotein Cholesterol; Non-HDL-C: Non-High-Density Lipoprotein Cholesterol; PPG: Postprandial Plasma Glucose; r: Correlation Coefficient; SD: Standard Deviation; SEM: Standard Error of the Mean; SGLT2: Sodium-glucose co-transporter 2; TC: Total Cholesterol; TG: Triglycerides.
Note: Paired t-tests were used to compare continuous variables from baseline to 3 months post-treatment. P < 0.05 was considered statistically significant, p < 0.01 highly significant, and p < 0.001 very highly significant. Table 4. Effects of SGLT2 inhibitors on female patient’s biological parameters (n = 331, EF n = 76). Parameter Time point Mean SD SEM Change % Change P-value r Weight (Kg) Before 92.14 18.51 1.02 - 3.96 -4.29 < 0.001 0.98 After 88.19 17.15 0.94 BMI (Kg/m2) Before 37.49 7.21 0.40 -1.60 -4.27 < 0.001 0.98 After 35.89 6.74 0.37 Systolic BP (mmHg) Before 131.44 14.90 0.82 -7.18 -5.47 < 0.001 0.71 After 124.26 13.49 0.74 Diastolic BP (mmHg) Before 82.33 10.32 0.57 -3.78 -4.59 < 0.001 0.51 After 78.55 7.26 0.40 FPG (mg/dL) Before 187.01 62.55 3.44 -36.88 -19.72 < 0.001 0.61 After 150.13 50.99 2.80 PPG (mg/dL) Before 220.69 77.48 4.26 -43.83 -19.86 < 0.001 0.67 After 176.86 62.00 3.41 HbA1c (%) Before 9.54 1.77 0.10 -1.23 -12.92 < 0.001 0.72 After 8.31 1.41 0.08 TG (mg/dL) Before 173.37 84.64 4.65 -37.77 -21.78 < 0.001 0.74 After 135.60 54.96 3.02 HDL-C (mg/dL) Before 46.89 16.63 0.91 1.48 3.16 0.010 0.79 After 48.37 15.07 0.83 TC (mg/dL) Before 177.72 43.70 2.40 -23.03 -12.96 < 0.001 0.64 After 154.69 39.86 2.19 Non-HDL-C (mg/dL) Before 129.12 45.33 2.49 -23.87 -18.49 < 0.001 0.62 After 105.26 39.65 2.18 LDL-C (mg/dL) Before 103.69 36.84 2.02 -14.93 -14.39 < 0.001 0.69 After 88.76 30.96 1.70 Plasma urea (mg/dL) Before 32.38 13.67 0.75 -4.04 -12.48 < 0.001 0.69 After 28.34 10.42 0.57 Plasma Cr (mg/dL) Before 0.78 0.28 0.02 -0.13 -16.06 < 0.001 0.79 After 0.66 0.21 0.01 eGFR (mL/min/1.73m²) Before 83.05 21.10 1.16 9.40 11.32 < 0.001 0.82 After 92.45 18.38 1.01 MAU (mg/g Cr) Before 100.87 259.60 14.27 -47.81 -47.40 < 0.001 0.89 After 53.06 145.75 8.01 EF (%) Before 50.78 12.29 1.41 6.30 12.41 < 0.001 0.90 After 57.08 11.10 1.27 Abbreviations: BMI: Body Mass Index; BP: Blood Pressure; Cr: Creatinine; EF: Ejection Fraction; eGFR: Estimated Glomerular Filtration Rate; FPG: Fasting Plasma Glucose; HbA1c: Glycated hemoglobin; HDL-C: High-Density Lipoprotein Cholesterol; LDL-C: Low-Density Lipoprotein Cholesterol; Non-HDL-C: Non-High-Density Lipoprotein Cholesterol; PPG: Postprandial Plasma Glucose; r: Correlation Coefficient; SD: Standard Deviation; SEM: Standard Error of the Mean; SGLT2: Sodium-glucose co-transporter 2; TC: Total Cholesterol; TG: Triglycerides.
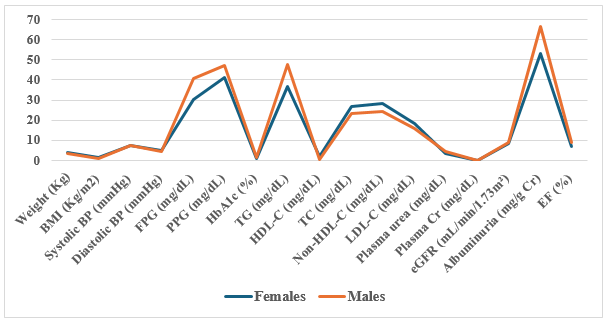
Note: Paired t-tests were used to compare continuous variables from baseline to 3 months post-treatment. P < 0.05 was considered statistically significant, p < 0.01 highly significant, and p < 0.001 very highly significant. Figure 2. Mean Changes in Clinical Parameters by Gender and Dapagliflozin. Figure 2 illustrates the mean changes in clinical parameters specifically for patients treated with dapagliflozin (n=279), stratified by gender. In this subgroup, male patients demonstrated a pronounced mean reduction in systolic blood pressure of 7.6 mmHg and a fasting plasma glucose (FPG) drop of 39.5 mg/dL. Female patients treated with dapagliflozin, conversely, showed greater improvements in different metabolic markers, experiencing a more significant mean reduction in postprandial glucose (PPG) of 44.8 mg/dL and a notable decrease in plasma urea of 4.3 mg/dL.
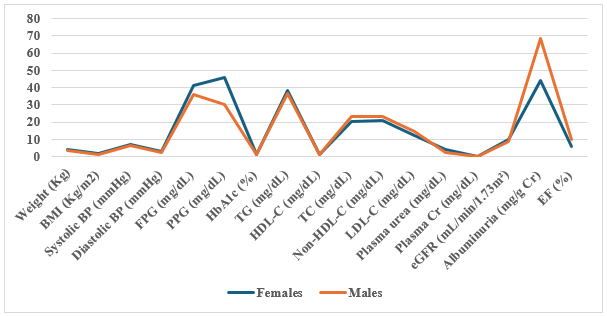
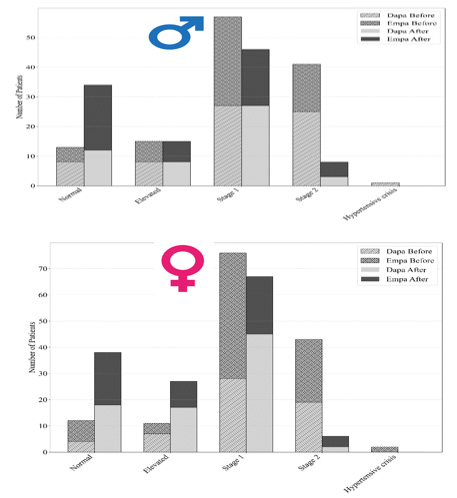
Figure 3. Mean Changes in Clinical Parameters by Gender and Empagliflozin. Figure 3 details the corresponding parameter changes for patients administered empagliflozin (n=321). In this cohort, females achieved a slightly greater mean weight reduction of 4.2 kg compared to a 3.5 kg reduction in males. However, male patients showed superior improvements in their lipid profiles, notably a reduction in triglycerides (TG) of 43.8 mg/dL, compared to 38.2mg/dL in females. Renal protection markers were consistent across both genders in this group, with the estimated glomerular filtration rate (eGFR) increasing by an average of 9.8 mL/min/1.73m2. Figure 4. The Effect of SGLT2 Inhibitors on Classification of HTN Among the Participants. The broad impact of SGLT2 inhibitors on cardiovascular strain is further highlighted by the shifts in hypertension (HTN) classification among participants, summarized in Figure 4.
At baseline, 46% of the total cohort was classified as having Stage 2 hypertension (systolic ≥140 mmHg or diastolic ≥ 90 mmHg). Following three months of SGLT2 inhibitor therapy, this proportion significantly decreased to 29%. Concurrently, the percentage of patients classified within the “Elevated” or “Normal” blood pressure categories increased from 14% at baseline to 35% post-intervention, underscoring the systemic hemodynamic benefits of the treatment. Table 5. BMI Changes in the Patients Treated with Dapa or Empa. Empagliflozin BMI Dapagliflozin Comment Change (n) Before (n) After (n) Categories After (n) Before (n) Change (n) Overall effect For 0 0 0 Underweight 1 1 0 ↔ --- 2 9 11 Normal 14 11 3 ↑ Dapa 11 42 53 Overweight 47 40 7 ↑ Empa 7- 39 32 Moderate obesity 53 54 -1 ↓ Empa 1- 23 22 Severe obesity 15 20 -5 ↓ Dapa 5- 14 9 Morbid obesity 12 16 -4 ↓ Empa Figure 5 isolates the changes in Body Mass Index (BMI), directly comparing the efficacy of the two prescribed medications.
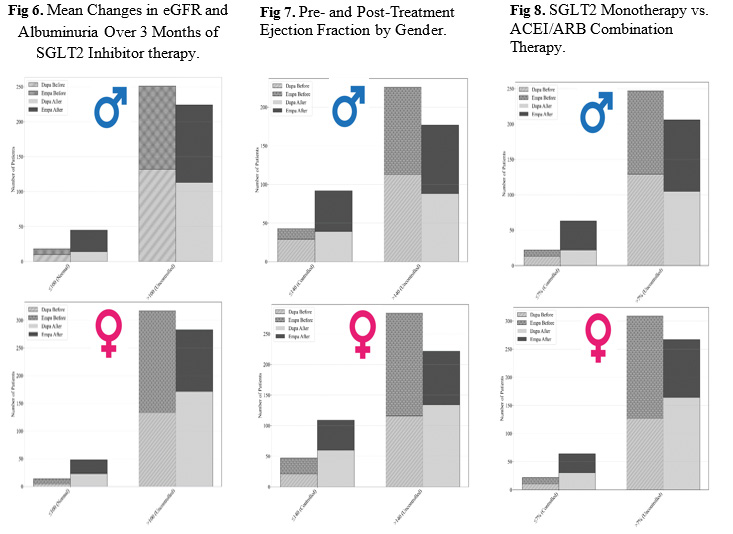
While both drugs yielded highly significant weight loss (p<0.001), patients treated with empagliflozin demonstrated a numerically greater mean BMI reduction of 1.62kg/m2 (dropping from a baseline of 35.45 to 33.83 kg/m2). In comparison, the dapagliflozin group experienced a mean BMI reduction of 1.21 kg/m2 (dropping from 34.98 to 33.77 kg/m2). This aligns with the overall finding that while SGLT2 inhibitors universally improve metabolic profiles, empagliflozin shows a slightly more pronounced effect on BMI and weight management.The profound renoprotective effects of SGLT2 inhibitors within the cohort are visualized in Figure 6, which tracks the inverse relationship between estimated Glomerular Filtration Rate (eGFR) and albuminuria over the three-month period. Across the entire cohort, patients experienced a significant mean increase in eGFR from 84.7 to 93.86 mL/min/1.73m2.
Concurrently, this improvement in renal filtration was paired with a drastic reduction in renal stress, depicted by a 47.06% decrease in mean albuminuria (dropping from a baseline of 120.44 mg/g Cr to 63.76 mg/g Cr). This confirms the drugs’ efficacy in mitigating diabetic nephropathy progression. Figure 7 highlights the cardioprotective benefits by detailing the changes in Ejection Fraction (EF) in the subset of patients (n=155) who had complete echocardiographic data. The bar chart demonstrates a remarkable recovery in myocardial function, with the overall mean EF increasing from a baseline of 45.87% to 53.60% post-treatment. Notably, male participants showed a more pronounced cardiac recovery, with their mean EF increasing by 22.11% compared to a 12.41% increase in female participants, suggesting potential sex-specific hemodynamic responses to the therapy.
Finally,Figure8addressestheevaluationofpotentialsynergisticeffectsbetweenSGLT2inhibitorsandstandardantihypertensive medications. The analysis compared a subgroup of patients on SGLT2 inhibitor monotherapy against those receiving concomitant therapy with Angiotensin-Converting Enzyme Inhibitors (ACEIs) or Angiotensin II Receptor Blockers (ARBs). Contrary to expectations of a compounded effect, the data revealed no statistically significant differences in the reduction of systolic blood pressure (p=0.31), diastolic blood pressure (p=0.45), or albuminuria (p=0.28) between the monotherapy and combination therapy groups. Both groups achieved parallel, highly significant improvements from their respective baselines, indicating that the cardiorenal and metabolic benefits of SGLT2 inhibitors are independently robust and not reliant on ACEI/ ARB co-administration. In addition, Table 6. illustrates the shifts in lipid profile classifications before and after treatment with SGLT2 inhibitors in men and women.
Table 6. Changes in Kidney Function Test Classifications Before and After SGLT2 Inhibitors. Lipid profile Classification Male before SGLT2 inhibitor Male after SGLT2 inhibitor Female before SGLT2 inhibitor Female after SGLT2 inhibitor TC mg/dL Normal < 200 218 252 228 295 Borderline high 200 - 239 35 12 79 27 High ≥ 240 16 5 24 9 LDL-C mg/dL Normal < 130 214 246 259 301 Borderline high 130 - 159 36 18 44 24 High 160 - 189 16 4 21 5 Very high ≥ 190 3 1 7 1 HDL-C mg/dL At risk ≤ 50 for male 235 230 127 94 ≤ 40 for female Normal > 50 for male 34 39 204 237 > 40 for female TG mg/dL Normal < 150 128 191 158 220 Borderline high 150 - 199 70 45 83 66 High ≥ 200 71 33 90 45 Non-HDL-C mg/dL Normal ≤130 161 221 168 238 High >130 108 48 163 93 Total 269 269 331 331
Discussion
The cohort included 55.2% females and 44.8% males, with the majority aged 51–70 years and a median diabetes duration of 15.4 years. Cardiovascular comorbidities were highly prevalent, with hypertension in 79.7% and ischemic heart disease in 46%. Males exhibited higher rates of PVD and IHD, while females had higher rates of hypertension. Declining eGFR was observed in individuals aged 60+ and those with longer diabetes duration. SGLT2i initiation was more common in females, with Empagliflozin demonstrating superior reductions in weight, BMI, fasting plasma glucose (FPG), and eGFR compared to Dapagliflozin. Concomitant therapy was frequent with metformin (93%) and insulin (80.7%), alongside β blockers, ARBs, ACE inhibitors, and statins. Adverse event rates were low overall, with genitourinary tract infections (48%) and diabetic ketoacidosis (28%) being the most notable.
Clinical outcomes showed significant improvements in glycemic control (FPG, PPG, HbA1c), BMI categories, lipid profiles, and kidney function classifications. Sodium–glucose cotransporter 2 (SGLT2) inhibitors have emerged as a cornerstone in the management of type 2 diabetes (T2D), offering benefits that extend beyond glycaemic control [9]. Clinical evidence demonstrates robust cardiorenal protection, with reductions in cardiovascular death and hospitalizations for heart failure observed in both diabetic and nondiabetic patients with reduced ejection fraction [10]. These effects are mediated through inhibition of glucose reabsorption in the proximal renal tubules, leading to improved hemodynamic, enhanced sodium excretion, and reduced myocardial stress [11]. Additionally, SGLT2 inhibitors promote a metabolic shift from glucose to ketone utilization, potentially improving myocardial efficiency [12].
Landmark randomized clinical trials (RCTs) have substantiated these findings. The EMPA-REG OUTCOME trial (empagliflozin) and DECLARE-TIMI 58 trial (dapagliflozin) reported significant reductions in heart failure-related death and hospitalization [13]. Similarly, the CANVAS program (canagliflozin) demonstrated slower decline in estimated glomerular filtration rate (eGFR) and reduced albuminuria, while EMPA- REG also showed reduced progression to end-stage renal disease [14-15]. These renoprotective effects are attributed to reductions in glomerular hyperfiltration and modulation of tubuloglomerular feedback [15]. Beyond hemodynamic and metabolic mechanisms, SGLT2 inhibitors may exert cardioprotective effects through activation of nutrient deprivation pathways. By inducing a fasting-like paradigm, they appear to stimulate sirtuin-1 (SIRT1) and downstream mediators such as PGC-1α and FGF21, which are known to alleviate oxidative stress, promote autophagy, and enhance mitochondrial function [16].
Notably, SGLT2 is not expressed in the heart, yet activation of the SIRT1/PGC-1α/FGF21 axis provides a plausible explanation for their cardioprotective profile. While no direct clinical trials have specifically investigated SIRT1 activation by SGLT2 inhibitors, preclinical evidence and overlapping biological effects strongly suggest a potential interplay that warrants further exploration. Subgroup analyses from major RCTs have also addressed gender and obesity. Few trials have directly targeted obese populations, but several have reported consistent cardiovascular and renal protection across BMI categories, with modest weight loss and improved metabolic control [17]. Importantly, benefits are observed in both men and women, with no clinically significant sex differences. This supports the use of SGLT2 inhibitors irrespective of gender or obesity status, though lifestyle interventions remain essential for more substantial weight reduction.
Comparisons with earlier intensive glycemic control trials (UKPDS, ACCORD, ADVANCE, VADT) highlight a paradigm shift: while strict glucose lowering yielded mixed cardiovascular outcomes, SGLT2 inhibitors demonstrate multi-system protective effects independent of glycemic control [18]. Together with glucagon-like peptide-1 receptor agonists (GLP- 1 RAs), they represent a new era of cardiometabolic therapy in high-risk T2D patients [19]. Total cholesterol shows a clear improvement, with more individuals in the normal category and a decrease in borderline and high categories, indicating SGLT2 inhibitors effectively normalize cholesterol levels. LDL-C, known as “bad cholesterol,” also reflects this pattern, with increased normal classifications for both sexes and fewer patients in the higher risk categories, suggesting cardiovascular risk protection, Evidence suggests SGLT2 inhibitors improve lipid metabolism, modestly lowering triglycerides and LDL-C while raising HDL-C.
[20]. The study showed that HDL-C, or “good cholesterol,” improves more significantly in women compared to men, with a notable increase in those classified as normal. Triglycerides also exhibit positive changes, with more patients falling into the normal category post-treatment and reductions in borderline and high classifications. Non-HDL cholesterol, which encompasses all atherogenic particles, shows significant improvement as well, with more patients classified as normal and fewer in high-risk categories. Genetic analyses confirm that SGLT2 inhibition reduces risks of heart failure, coronary artery disease, and stroke, with part of the benefit mediated by changes in blood lipids (especially non-HDL cholesterol and LDL-C) [20-24]. Overall, SGLT2 inhibitors contribute to a healthier lipid profile by decreasing harmful cholesterol fractions and increasing beneficial ones.
While both sexes benefit, women show greater improvements in HDL levels [25]. These findings suggest that SGLT2 inhibitors may also reduce cardiovascular risk in addition to their known glucose control and kidney protection benefits through favorable lipid modulation. Conclusion and guidance for the future work This real-world study proved that SGLT2 inhibitors act as multi-system protective agents, not merely glucose-lowering drugs. They provide consistent cardiovascular and renal protection across sexes and BMI categories, with modest improvements in diabetic dyslipidemia and metabolic control. Although direct clinical evidence linking SGLT2 inhibitors to SIRT1 activation is lacking, the overlap in biological pathways suggests a promising mechanistic connection that may contribute to their cardioprotective effects.
Future research should clarify this interaction, as understanding the role of SIRT1 could inform the development of novel therapeutic strategies for diabetes and cardiovascular disease. Limitations This study has several important limitations. Its retrospective observational design without a control group restricts causal inference and leaves results vulnerable to confounding. Missing data for key parameters such as family history and ejection fraction may have introduced bias, while the short three month follow up captures only immediate outcomes rather than long term cardiorenal protection. Subgroup analyses were underpowered, raising the risk of Type II error, and uncontrolled confounders such as lifestyle factors and concurrent medications further limit interpretability. Patient adherence and variability in data recording were not measured, potentially influencing outcomes, and finally, the findings may have limited generalizability to other ethnicities, populations, or healthcare systems.
Acknowledgment The researchers express their sincere gratitude to all the staff at the Benghazi Diabetes Center, where this real-world study was conducted. Their dedication and professional competence were essential at every stage of the research. From patient recruitment and data collection to laboratory analysis and clinical follow-up, the efforts of the physicians, nurses, laboratory technicians, and administrative staff ensured the smooth progress of the study. We especially appreciate their collaborative spirit and commitment to patient care, which made this work possible. Without their collective efforts, this study would not have been possible.
Figures and Tables
| Characteristic | Male | Female | Total |
|---|---|---|---|
| Gender Age | 269 (44.8%) | 331 (55.2%) | 600 (100%) |
| ≤ 40 years | 10 (3.7%) | 3 (0.9%) | 13 (2.2%) |
| 41 – 50 years | 43 (16.0%) | 26 (7.9%) | 69 (11.5%) |
| 51 – 60 years | 84 (31.2%) | 115 (34.7%) | 199 (33.2%) |
| 61 – 70 years | 69 (25.7%) | 122 (36.8%) | 191 (31.8%) |
| 71 – 80 years | 51 (19.0%) | 59 (17.8%) | 110 (18.3%) |
| > 80 years Duration of T2DM | 12 (4.5%) | 6 (1.8%) | 18 (3%) |
| < 10 years | 69 (25.7%) | 75 (22.7%) | 144 (24%) |
| 10-19 years | 103 (38.2%) | 157 (47.4%) | 260 (43.3%) |
| 20-29 years | 77 (28.6%) | 82 (24.8%) | 159 (26.5%) |
| ≥ 30 years Smoking | 20 (7.4%) | 17 (5.1%) | 37 (6.2%) |
| Smoking | 71 (26.4%) | 0 (0%) | 71 (11.8%) |
| Non-smoking Family history of T2DM | 198 (73.6%) | 331 (100%) | 529 (88.2%) |
| Yes | 97 (36.1%) | 115 (34.7%) | 212 (35.3%) |
| No | 6 (2.2%) | 10 (3.0%) | 16 (2.7%) |
| Unavailable SGLT2 inhibitors members and their doses | 166 (61.7%) | 206 (62.1%) | 372 (62%) |
| Empagliflozin (all doses) | 127 (47.2%) | 194 (58.6%) | 321 (53.5%) |
| Empagliflozin 25 mg | 42 (15.6%) | 53 (16.0%) | 95 (15.8%) |
| Empagliflozin 12.5 mg | 20 (7.4%) | 45 (13.6%) | 65 (10.8%) |
| Empagliflozin 10 mg | 65 (24.2%) | 96 (29.0%) | 161 (26.8%) |
| Dapagliflozin (all doses) | 142 (52.7%) | 137 (41.4%) | 279 (46.5%) |
| Dapagliflozin 10 mg | 98 (36.4%) | 118 (35.7%) | 216 (36%) |
| Dapagliflozin 5 mg | 44 (16.4%) | 19 (5.7%) | 63 (10.5%) |
| Parameter | Time point | Mean | SD | SEM | Change | % Change | P-value | r |
|---|---|---|---|---|---|---|---|---|
| Weight (Kg) | Before | 93.61 | 18.17 | 0.74 | -3.77 | -4.03 | < 0.001 | 0.99 |
| After | 89.84 | 16.96 | 0.69 | |||||
| BMI (Kg/m2) | Before | 35.23 | 7.16 | 0.29 | -1.43 | -4.06 | < 0.001 | 0.99 |
| After | 33.80 | 6.73 | 0.27 | |||||
| Systolic BP (mmHg) | Before | 131.78 | 16.26 | 0.66 | -7.06 | -5.36 | < 0.001 | 0.68 |
| After | 124.72 | 13.86 | 0.57 | |||||
| Diastolic BP (mmHg) | Before | 82.09 | 9.38 | 0.38 | -3.61 | -4.39 | < 0.001 | 0.46 |
| After | 78.48 | 6.87 | 0.28 | |||||
| FPG (mg/dL) | Before | 186.36 | 64.89 | 2.65 | -37.63 | -20.20 | < 0.001 | 0.58 |
| After | 148.73 | 51.01 | 2.08 | |||||
| PPG (mg/dL) | Before | 217.59 | 74.43 | 3.04 | -41.80 | -19.21 | < 0.001 | 0.65 |
| After | 175.79 | 62.90 | 2.57 | |||||
| HbA1c (%) | Before | 9.47 | 1.79 | 0.07 | -1.25 | -13.20 | < 0.001 | 0.70 |
| After | 8.22 | 1.42 | 0.06 | |||||
| TG (mg/dL) | Before | 175.78 | 95.65 | 3.90 | -39.91 | -22.70 | < 0.001 | 0.76 |
| After | 135.87 | 60.07 | 2.45 | |||||
| HDL-C (mg/dL) | Before | 43.97 | 14.59 | 0.60 | 1.18 | 2.68 | 0.004 | 0.75 |
| After | 45.15 | 13.56 | 0.55 | |||||
| TC (mg/dL) | Before | 171.45 | 46.08 | 1.88 | -23.20 | -13.53 | < 0.001 | 0.64 |
| After | 148.25 | 39.40 | 1.61 | |||||
| Non-HDL-C (mg/dL) | Before | 125.67 | 47.03 | 1.92 | -23.80 | -18.94 | < 0.001 | 0.62 |
| After | 101.87 | 39.08 | 1.60 | |||||
| LDL-C (mg/dL) | Before | 100.50 | 37.71 | 1.54 | -15.10 | -15.02 | < 0.001 | 0.67 |
| After | 85.40 | 31.61 | 1.29 | |||||
| Plasma Urea (mg/dL) | Before | 33.46 | 14.38 | 0.59 | -3.85 | -11.51 | < 0.001 | 0.66 |
| After | 29.61 | 10.91 | 0.45 | |||||
| Plasma Cr (mg/dL) | Before | 0.86 | 0.31 | 0.01 | -0.13 | -15.12 | < 0.001 | 0.81 |
| After | 0.73 | 0.24 | 0.01 | |||||
| eGFR (mL/min/1.73m²) | Before | 84.74 | 21.86 | 0.89 | 9.12 | 10.76 | < 0.001 | 0.83 |
| After | 93.86 | 19.56 | 0.80 | |||||
| Albuminuria (mg/g Cr) | Before | 120.44 | 287.84 | 11.75 | -56.68 | -47.06 | < 0.001 | 0.86 |
| After | 63.76 | 177.85 | 7.26 | |||||
| EF (%) | Before | 45.87 | 12.65 | 1.02 | 7.73 | 16.85 | < 0.001 | 0.89 |
| After | 53.60 | 11.27 | 0.91 |
| Parameter | Time point | Mean | SD | SEM | Change | % Change | P-value | r |
|---|---|---|---|---|---|---|---|---|
| Weight (Kg) | Before | 95.41 | 17.60 | 1.07 | -3.53 | -3.70 | < 0.001 | 0.99 |
| After | 91.88 | 16.53 | 1.01 | |||||
| BMI (Kg/m2) | Before | 32.42 | 6.02 | 0.37 | -1.19 | - 3.67 | < 0.001 | 0.99 |
| After | 31.23 | 5.77 | 0.35 | |||||
| Systolic BP (mmHg) | Before | 132.20 | 17.80 | 1.09 | -6.93 | - 5.24 | < 0.001 | 0.64 |
| After | 125.28 | 14.31 | 0.87 | |||||
| Diastolic BP (mmHg) | Before | 81.80 | 8.08 | 0.49 | -3.40 | - 4.15 | < 0.001 | 0.36 |
| After | 78.40 | 6.37 | 0.39 | |||||
| FPG (mg/dL) | Before | 185.55 | 67.76 | 4.13 | -38.55 | -20.78 | < 0.001 | 0.55 |
| After | 147.00 | 51.07 | 3.11 | |||||
| PPG (mg/dL) | Before | 213.77 | 70.45 | 4.30 | -39.29 | -18.38 | < 0.001 | 0.62 |
| After | 174.48 | 64.08 | 3.91 | |||||
| HbA1c (%) | Before | 9.37 | 1.81 | 0.11 | -1.26 | - 13.44 | < 0.001 | 0.67 |
| After | 8.11 | 1.43 | 0.09 | |||||
| TG (mg/dL) | Before | 178.74 | 107.75 | 6.57 | -42.54 | -23.80 | < 0.001 | 0.78 |
| After | 136.20 | 65.92 | 4.02 | |||||
| HDL-C (mg/dL) | Before | 40.37 | 10.57 | 0.64 | 0.81 | 2.01 | 0.150 | 0.60 |
| After | 41.18 | 10.13 | 0.62 | |||||
| TC (mg/dL) | Before | 163.74 | 47.82 | 2.92 | -23.42 | -14.30 | < 0.001 | 0.63 |
| After | 140.32 | 37.40 | 2.28 | |||||
| Non-HDL-C (mg/dL) | Before | 121.42 | 48.79 | 2.98 | -23.72 | -19.54 | < 0.001 | 0.62 |
| After | 97.70 | 38.03 | 2.32 | |||||
| LDL-C (mg/dL) | Before | 96.56 | 38.46 | 2.35 | -15.30 | -15.84 | < 0.001 | 0.64 |
| After | 81.27 | 31.96 | 1.95 | |||||
| Plasma urea (mg/dL) | Before | 34.78 | 15.13 | 0.92 | -3.60 | -10.38 | < 0.001 | 0.63 |
| After | 31.18 | 11.32 | 0.69 | |||||
| Plasma Cr (mg/dL) | Before | 0.95 | 0.31 | 0.02 | -0.13 | -13.80 | < 0.001 | 0.79 |
| After | 0.82 | 0.25 | 0.02 | |||||
| eGFR (mL/min/1.73m²) | Before | 86.82 | 22.62 | 1.38 | 8.78 | 10.11 | < 0.001 | 0.83 |
| After | 95.60 | 20.82 | 1.27 | |||||
| Albuminuri (mg/g Cr) | Before | 144.53 | 318.03 | 19.39 | -67.61 | -46.78 | < 0.001 | 0.85 |
| After | 76.92 | 210.29 | 12.82 | |||||
| EF (%) | Before | 41.15 | 11.18 | 1.26 | 9.10 | 22.11 | < 0.001 | 0.85 |
| After | 50.25 | 10.45 | 1.18 |
| Parameter | Time point | Mean | SD | SEM | Change | % Change | P-value | r |
|---|---|---|---|---|---|---|---|---|
| Weight (Kg) | Before | 92.14 | 18.51 | 1.02 | - 3.96 | -4.29 | < 0.001 | 0.98 |
| After | 88.19 | 17.15 | 0.94 | |||||
| BMI (Kg/m2) | Before | 37.49 | 7.21 | 0.40 | -1.60 | -4.27 | < 0.001 | 0.98 |
| After | 35.89 | 6.74 | 0.37 | |||||
| Systolic BP (mmHg) | Before | 131.44 | 14.90 | 0.82 | -7.18 | -5.47 | < 0.001 | 0.71 |
| After | 124.26 | 13.49 | 0.74 | |||||
| Diastolic BP (mmHg) | Before | 82.33 | 10.32 | 0.57 | -3.78 | -4.59 | < 0.001 | 0.51 |
| After | 78.55 | 7.26 | 0.40 | |||||
| FPG (mg/dL) | Before | 187.01 | 62.55 | 3.44 | -36.88 | -19.72 | < 0.001 | 0.61 |
| After | 150.13 | 50.99 | 2.80 | |||||
| PPG (mg/dL) | Before | 220.69 | 77.48 | 4.26 | -43.83 | -19.86 | < 0.001 | 0.67 |
| After | 176.86 | 62.00 | 3.41 | |||||
| HbA1c (%) | Before | 9.54 | 1.77 | 0.10 | -1.23 | -12.92 | < 0.001 | 0.72 |
| After | 8.31 | 1.41 | 0.08 | |||||
| TG (mg/dL) | Before | 173.37 | 84.64 | 4.65 | -37.77 | -21.78 | < 0.001 | 0.74 |
| After | 135.60 | 54.96 | 3.02 | |||||
| HDL-C (mg/dL) | Before | 46.89 | 16.63 | 0.91 | 1.48 | 3.16 | 0.010 | 0.79 |
| After | 48.37 | 15.07 | 0.83 | |||||
| TC (mg/dL) | Before | 177.72 | 43.70 | 2.40 | -23.03 | -12.96 | < 0.001 | 0.64 |
| After | 154.69 | 39.86 | 2.19 | |||||
| Non-HDL-C (mg/dL) | Before | 129.12 | 45.33 | 2.49 | -23.87 | -18.49 | < 0.001 | 0.62 |
| After | 105.26 | 39.65 | 2.18 | |||||
| LDL-C (mg/dL) | Before | 103.69 | 36.84 | 2.02 | -14.93 | -14.39 | < 0.001 | 0.69 |
| After | 88.76 | 30.96 | 1.70 | |||||
| Plasma urea (mg/dL) | Before | 32.38 | 13.67 | 0.75 | -4.04 | -12.48 | < 0.001 | 0.69 |
| After | 28.34 | 10.42 | 0.57 | |||||
| Plasma Cr (mg/dL) | Before | 0.78 | 0.28 | 0.02 | -0.13 | -16.06 | < 0.001 | 0.79 |
| After | 0.66 | 0.21 | 0.01 | |||||
| eGFR (mL/min/1.73m²) | Before | 83.05 | 21.10 | 1.16 | 9.40 | 11.32 | < 0.001 | 0.82 |
| After | 92.45 | 18.38 | 1.01 | |||||
| MAU (mg/g Cr) | Before | 100.87 | 259.60 | 14.27 | -47.81 | -47.40 | < 0.001 | 0.89 |
| After | 53.06 | 145.75 | 8.01 | |||||
| EF (%) | Before | 50.78 | 12.29 | 1.41 | 6.30 | 12.41 | < 0.001 | 0.90 |
| After | 57.08 | 11.10 | 1.27 |
| Empagliflozin | BMI | Dapagliflozin | Comment | |||||
|---|---|---|---|---|---|---|---|---|
| Change (n) | Before (n) | After (n) | Categories | After (n) | Before (n) | Change (n) | Overall effect | For |
| 0 | 0 | 0 | Underweight | 1 | 1 | 0 | ↔ | --- |
| 2 | 9 | 11 | Normal | 14 | 11 | 3 | ↑ | Dapa |
| 11 | 42 | 53 | Overweight | 47 | 40 | 7 | ↑ | Empa |
| 7- | 39 | 32 | Moderate obesity | 53 | 54 | -1 | ↓ | Empa |
| 1- | 23 | 22 | Severe obesity | 15 | 20 | -5 | ↓ | Dapa |
| 5- | 14 | 9 | Morbid obesity | 12 | 16 | -4 | ↓ | Empa |
| Lipid profile Classification TC mg/dL | Male before SGLT2 inhibitor | Male after SGLT2 inhibitor | Female before SGLT2 inhibitor | Female after SGLT2 inhibitor | |
|---|---|---|---|---|---|
| Normal | < 200 | 218 | 252 | 228 | 295 |
| Borderline high | 200 - 239 | 35 | 12 | 79 | 27 |
| High LDL-C mg/dL | ≥ 240 | 16 | 5 | 24 | 9 |
| Normal | < 130 | 214 | 246 | 259 | 301 |
| Borderline high | 130 - 159 | 36 | 18 | 44 | 24 |
| High | 160 - 189 | 16 | 4 | 21 | 5 |
| Very high HDL-C mg/dL | ≥ 190 | 3 | 1 | 7 | 1 |
| At risk | ≤ 50 for male | 235 | 230 | 127 | 94 |
| ≤ 40 for female | |||||
| Normal | > 50 for male | 34 | 39 | 204 | 237 |
| TG mg/dL | > 40 for female | ||||
| Normal | < 150 | 128 | 191 | 158 | 220 |
| Borderline high | 150 - 199 | 70 | 45 | 83 | 66 |
| High Non-HDL-C mg/dL | ≥ 200 | 71 | 33 | 90 | 45 |
| Normal | ≤130 | 161 | 221 | 168 | 238 |
| High | >130 | 108 | 48 | 163 | 93 |
| Total | 269 | 269 | 331 | 331 |
References
- Einarson TR, Acs A, Ludwig C, Panton UH. Prevalence of cardiovascular disease in type 2 diabetes: a systematic literature review of scientific evidence from across the world in 2007–2017. Cardiovasc Diabetol. 2018; 17:83.
- Cho NH, Shaw JE, Karuranga S, Huang Y, da Rocha Fernandes JD, Ohlrogge AW, et al. IDF Diabetes Atlas: global estimates of diabetes prevalence for 2017 and projections for 2045. Diabetes Res Clin Pract. 2018; 138:271–81.
- Nwaneri C, Cooper H, Bowen-Jones D. Mortality in type 2 diabetes mellitus: magnitude of the evidence from a systematic review and meta-analysis. Br J Diabetes Vasc Dis. 2013; 13:192–207.
- Barrera-Chimal J, Jaisser F. Pathophysiologic mechanisms in diabetic kidney disease: a focus on current and future therapeutic targets. Diabetes Obes Metab. 2020;22(Suppl 1):16-31. doi: 10.1111/ dom.13969.
- Zou H, Zhou B, Xu G. Correction to: SGLT2 inhibitors: a novel choice for the combination therapy in diabetic kidney disease. Cardiovasc Diabetol. 2018;17(1):38. doi: 10.1186/s12933-018-0676-1
- Alicic RZ, Rooney MT, Tuttle KR. Diabetic kidney disease: challenges, progress, and possibilities. Clin J Am Soc Nephrol. 2017;12(12):2032-2045. doi: 10.2215/ CJN.11491116
- Almourani R, Chinnakotla B, Patel R, Kurukulasuriya LR, Sowers J. Diabetes and cardiovascular disease: an update. Curr Diabetes Rep. 2019; 19:161.
- Zinman B, Wanner C, Lachin JM, Fitchett D, Bluhmki E, Hantel S, Mattheus M, Devins T, Johansen OE, Woerle HJ, Broedl UC, Inzucchi SE; EMPA-REG OUTCOME Investigators. Empagliflozin, Cardiovascular Outcomes, and Mortality in Type 2 Diabetes. N Engl J Med. 2015 Nov 26;373(22):2117-28. doi: 10.1056/NEJMoa1504720 Epub 2015 Sep 17. PMID: 26378978.
- American Diabetes Association Professional Practice Committee. 11. chronic kidney disease and risk management: standards of medical care in diabetes-2022. Diabetes Care. 2022;45(Suppl 3): S175-S184. doi: 10.2337/dc22-S011.11
- Roaeid RB, Kablan AA. Profile of diabetes health care at Benghazi Diabetes Centre, Libyan Arab Jamahiriya. East Mediterr Health J. 2007;13(1):168-176.
- McMurray JJV, DeMets DL, Inzucchi SE, Køber L, Kosiborod MN, Langkilde AM, Martinez FA, Bengtsson O, Ponikowski P, Sabatine MS, Sjöstrand M, Solomon SD; DAPA-HF Committees and Investigators. A trial to evaluate the effect of the sodium-glucose cotransporter 2 inhibitor dapagliflozin on morbidity and mortality in patients with heart failure and reduced left ventricular ejection fraction (DAPA-HF). Eur J Heart Fail. 2019 May;21(5):665-675. doi: 10.1002/ejhf.1432 Epub 2019 Mar 21. PMID: 30895697; PMCID: PMC6607736.
- Brown E, Wilding JPH, Alam U, Barber TM, Karalliedde J, Cuthbertson DJ. The expanding role of SGLT2 inhibitors beyond glucose-lowering to cardiorenal protection. Ann Med. 2021 Dec;53(1):2072-2089. doi: 10.1080/07853890.2020.1841281 PMID: 33107349; PMCID: PMC8592607.
- Ferrannini E, Mark M, Mayoux E. CV Protection in the EMPA-REG OUTCOME Trial: A “Thrifty Substrate” Hypothesis. Diabetes Care. 2016 Jul;39(7):1108-14. doi: 10.2337/dc16-0330 PMID: 27289126.
- Wiviott SD, Raz I, Bonaca MP, Mosenzon O, Kato ET, Cahn A, Silverman MG, Zelniker TA, Kuder JF, Murphy SA, Bhatt DL, Leiter LA, McGuire DK, Wilding JPH, Ruff CT, Gause- Nilsson IAM, Fredriksson M, Johansson PA, Langkilde AM, Sabatine MS; DECLARE–TIMI 58 Investigators. Dapagliflozin and Cardiovascular Outcomes in Type 2 Diabetes. N Engl J Med. 2019 Jan 24;380(4):347-357. 30415602.
- Neal B, Perkovic V, Mahaffey KW, de Zeeuw D, Fulcher G, Erondu N, Shaw W, Law G, Desai M, Matthews DR; CANVAS Program Collaborative Group. Canagliflozin and Cardiovascular and Renal Events in Type 2 Diabetes. N Engl J Med. 2017 Aug 17;377(7):644-657. doi: 10.1056/ NEJMoa1611925. Epub 2017 Jun 12. PMID: 28605608.
- Packer M, et al., EMPEROR-Reduced Trial Investigators. Cardiovascular and Renal Outcomes with Empagliflozin in Heart Failure. N Engl J Med. 2020 Oct 8;383(15):1413- 1424. doi: 10.1056/NEJMoa2022190 Epub 2020 Aug 28. PMID: 32865377.
- Abdelfadil Elgazzar R, Ramadan M. Sodium-Glucose Cotransporter-2 Inhibitors Across the Glycemic Spectrum: Cardiovascular and Renal Outcomes with Mechanistic Insights. Cureus. 2026 Mar 12;18(3):e105114. doi: 10.7759/cureus.105114 PMID: 41994768; PMCID: PMC13081046.
- Wright WL, Urquhart S, Brunton S. Beyond Blood Glucose andBloodPressureControlinType2Diabetes:Alternative Management Strategies to Prevent the Development and Progression of CKD. J Prim Care Community Health. 2023 Jan-Dec; 14:21501319231153599. doi: 10.1177/21501319231153599 PMID: 36935560; PMCID: PMC10031227.
- Davies MJ, Aroda VR, Collins BS, Gabbay RA, Green J, Maruthur NM, Rosas SE, Del Prato S, Mathieu C, Mingrone G, Rossing P, Tankova T, Tsapas A, Buse JB. Management of Hyperglycemia in Type 2 Diabetes, 2022. A Consensus Report by the American Diabetes Association (ADA) and the European Association for the Study of Diabetes (EASD). Diabetes Care. 2022 Nov 1;45(11):2753-2786. doi: 10.2337/dci22-0034 PMID: 36148880; PMCID: PMC10008140.
- AlKindi, F., Al-Omary, H. L., Hussain, Q., Al Hakim, M., Chaaban, A., & Boobes, Y. (2020). Outcomes of SGLT2 Inhibitors Use in Diabetic Renal Transplant Patients. Transplantation proceedings, 52(1), 175–178. https:// doi.org/10.1016/j.transproceed.2019.11.007
- Pahud de Mortanges, A., Salvador, D., Jr, Laimer, M., Muka, T., Wilhelm, M., & Bano, A. (2021). The Role of SGLT2 Inhibitors in Atherosclerosis: A Narrative Mini- Review. Frontiers in pharmacology, 12, 751214. https:// doi.org/10.3389/fphar.2021.751214
- Maik, M. H. B. A., Ibtisam, M., Sheikh, S., Malik, M. A. B. A., Ihsan, A., Arham, M., Haq, U., & Parveen, A. (2025). The Role of SGLT2 Inhibitors in Atherosclerosis: A Systematic Review. Journal of community hospital internal medicine perspectives, 15(4), 29–33. https:// doi.org/10.55729/2000-9666.1505
- Neshat S, Moradi H, Bidares M, et al. Sodium- Glucose Cotransporter 2 (SGLT2) Inhibitors and Lipid Modulation in Heart Failure: A Narrative Review. Cureus. 2025;17(12): e 99752. Published 2025 Dec 21. doi:10.7759/cureus.99752
- Kim, H. J., Park, H. A., Cho, Y. G., Kang, J. H., Kim, K. W., Kang, J. H., Kim, N. R., Chung, W. C., Kim, C. H., Whang, D. H., & Park, J. K. (2011). Gender Difference in the Level of HDL Cholesterol in Korean Adults. Korean journal of family medicine, 32(3), 173–181. https://doi org/10.4082/kjfm.2011.32.3.173
- Hanan Abushwereb, Khawla Al-kharbash and Altayeb Alkhadrawi. Reducing Body Weight and Improving Lipid Profile with SGLT-2 Inhibitors in Type 2 Diabetes: Current Evidence and Clinical Implications. Interventions Obes Diabetes. 6(4). IOD. 000645. 20
This is a text version generated from the article. For the formatted version of record (with original tables & figures), download the PDF →